The Metrics Divide: When Self-Service Analytics Creates More Confusion Than Clarity
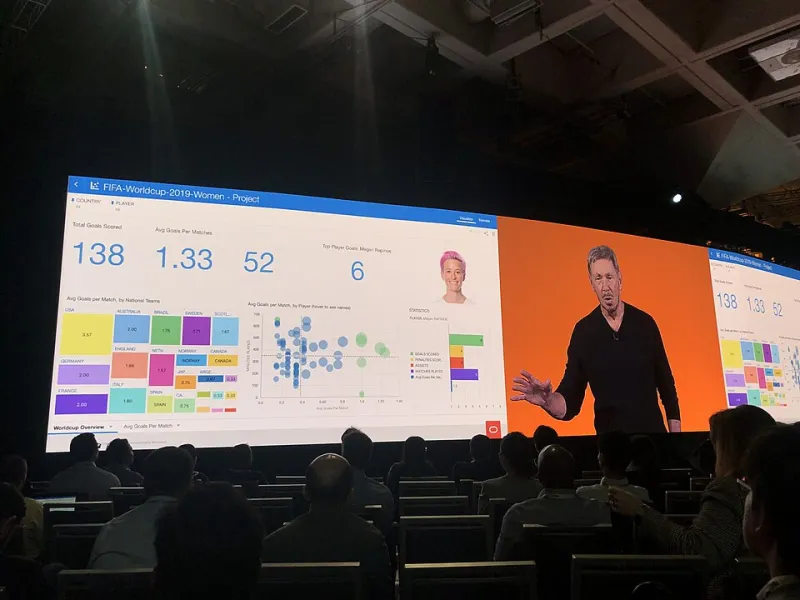
Photo: GeneralAB13, CC BY-SA 4.0, via Wikimedia Commons
The promise of self-service business intelligence was straightforward and genuinely appealing: give non-technical users the tools to answer their own questions with data, reduce the backlog of requests on overtaxed analytics teams, and accelerate the pace at which organizations can act on information. Platforms like Tableau, Power BI, Looker, and a growing roster of competitors made good on the access portion of that promise. Data that once required a SQL query and a three-day wait is now available to a marketing manager on a Tuesday morning without involving a single data engineer.
What the platforms did not solve — and what their vendors had limited incentive to emphasize — is the governance problem that emerges when dozens of individuals across an organization begin constructing their own data models, defining their own metrics, and drawing their own conclusions from sources that were never designed to be interpreted independently.
The result, in a significant number of US organizations that have invested heavily in BI democratization, is something that might be called shadow analytics: a proliferation of dashboards and reports that exist outside any formal data governance structure, built by well-intentioned people who are making consequential decisions based on numbers that do not agree with each other.
The Divergence Problem
Consider a scenario that is, by this point, familiar to anyone who has worked in or around corporate analytics. The sales team reports one revenue figure. Finance reports another. The discrepancy is not the result of fraud or error — it is the result of two teams using the same underlying data with different definitions applied at the transformation layer. Sales counts a deal as closed when the contract is signed. Finance counts it when the invoice is paid. Both are reasonable definitions. Neither team documented theirs. And no one realized they were measuring different things until the numbers appeared side by side in a board presentation.
This is not an edge case. It is a predictable consequence of empowering people to build their own analytics without establishing shared definitions, data lineage standards, or any mechanism for reconciling divergent outputs. When every team can build its own dashboard, every team will — and without coordination, those dashboards will disagree.
The disagreements are not always as visible as a revenue discrepancy. More often, they are subtle: a customer count that differs by a few hundred depending on how "active" is defined, a conversion rate that varies based on whether trial users are included, a churn metric that produces different results depending on which product line is in scope. Each individual figure is defensible in isolation. Together, they make it extraordinarily difficult to have a coherent organizational conversation about performance.
How Organizations Arrive Here
The path to shadow analytics is rarely the result of poor planning alone. It typically begins with a genuine and legitimate problem: a central analytics team that cannot keep pace with the volume of requests coming from the business. Departments wait weeks for reports that should take hours. Urgent questions go unanswered because the queue is too long. Leadership, frustrated by the pace, authorizes the purchase of self-service BI tools and encourages teams to take ownership of their own data needs.
This is a reasonable response to a real constraint. The issue is that the authorization to access data is rarely accompanied by the organizational infrastructure needed to use it responsibly. Training focuses on the mechanics of the tool — how to build a chart, how to connect a data source — rather than on data literacy, metric definition, or the importance of aligning with existing standards. Governance policies, if they exist at all, are written for a centralized analytics model and never updated to account for the distributed one that has replaced it.
Over time, the organization accumulates a large and growing library of self-built reports. Some are accurate and well-constructed. Others contain errors that no one has caught. Many are outdated but still being referenced. And because no one owns the catalog, no one is in a position to assess the overall state of the analytics environment.
The Decision-Making Cost
The organizational cost of this situation is not abstract. When leadership cannot trust that two teams are measuring the same thing, the default response is to spend meeting time reconciling numbers rather than acting on them. Decisions are delayed while analysts investigate discrepancies. Competing metrics become proxies for competing priorities, and what should be a data-driven conversation becomes a political one about whose numbers are correct.
There is also a subtler cost: the erosion of confidence in data as a decision-making input. When executives have been burned enough times by metrics that turned out to be inconsistently defined, they begin to discount data in favor of intuition and experience. The investment in BI tooling produces the opposite of its intended effect — not because the tools failed, but because the organizational conditions for using them effectively were never established.
Reclaiming Structure Without Sacrificing Flexibility
The solution is not to reverse course and re-centralize all analytics work. That approach failed for a reason, and restoring the bottleneck it created would simply exchange one problem for another. The goal is to build a governance layer that operates alongside distributed analytics, not instead of it.
Several frameworks have proven effective in practice. The most widely adopted is the concept of a semantic layer or metrics catalog — a centralized repository of defined, approved metrics that any team can use as a foundation for their own analysis. When "revenue," "active customer," and "conversion rate" have canonical definitions that are documented, versioned, and accessible, teams retain the freedom to build their own reports while working from a shared vocabulary.
Data contracts represent a related approach: formal agreements between data producers and data consumers that specify what a given data source contains, how it should be interpreted, and what transformations are appropriate. These are particularly valuable in organizations where multiple teams draw from the same underlying data warehouse.
Organizational structure matters as well. Embedding a data governance function — even a small one — within the analytics practice gives the organization a mechanism for reviewing new reports before they enter broad circulation, maintaining the metrics catalog, and resolving definitional disputes before they surface in executive presentations.
Empowerment With Accountability
Self-service analytics, practiced well, is genuinely valuable. It does reduce bottlenecks, does accelerate decision-making, and does give business users a more direct relationship with the data that affects their work. The organizations that realize those benefits are not the ones that gave their teams the most powerful tools. They are the ones that paired access with accountability — that invested as much in governance infrastructure as they did in dashboard software.
For technology and operations leaders evaluating their current BI environment, the relevant question is not whether self-service analytics is worth pursuing. It is whether the organizational conditions exist to make it productive. If the metrics catalog is empty, if definitions live in the heads of individual analysts, and if no one owns the quality of the data environment, the dashboards will multiply and the clarity they were meant to provide will continue to recede.